03 Aug 2023 Jobless Claims Scorecard for States and the US
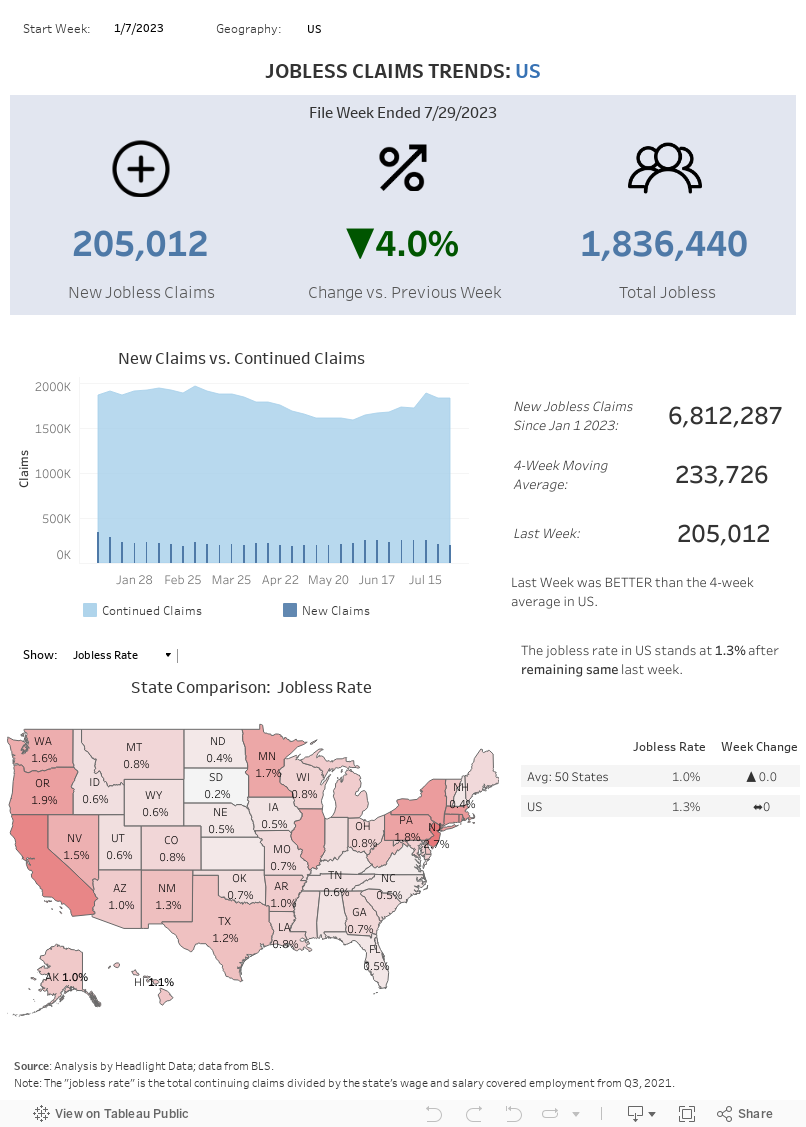
Headlight Data today released its updated Jobless Claims Scorecard for States and the US, which shows jobless claims trends and whether conditions are improving or worsening in individual states, an indicator for monthly unemployment levels.
Data is available for all weeks in 2021 and users can pick a state and customize the start week for the report’s analysis and charts.
Reports can be printed to PDF by clicking “Download” in the bottom-right corner.
Having trouble seeing the dashboard below? Visit our Tableau Public page.
Quarterly Economic Scorecard Shows Performance for Counties, Metros, and States
Headlight Data today released its updated Quarterly Economic Scorecard, which shows performance by quarter for ... Read more
Monthly Economic Scorecard Shows Performance for Metros
Headlight Data today released its updated Economic Scorecard for Metros, which shows performance versus metros ... Read more